
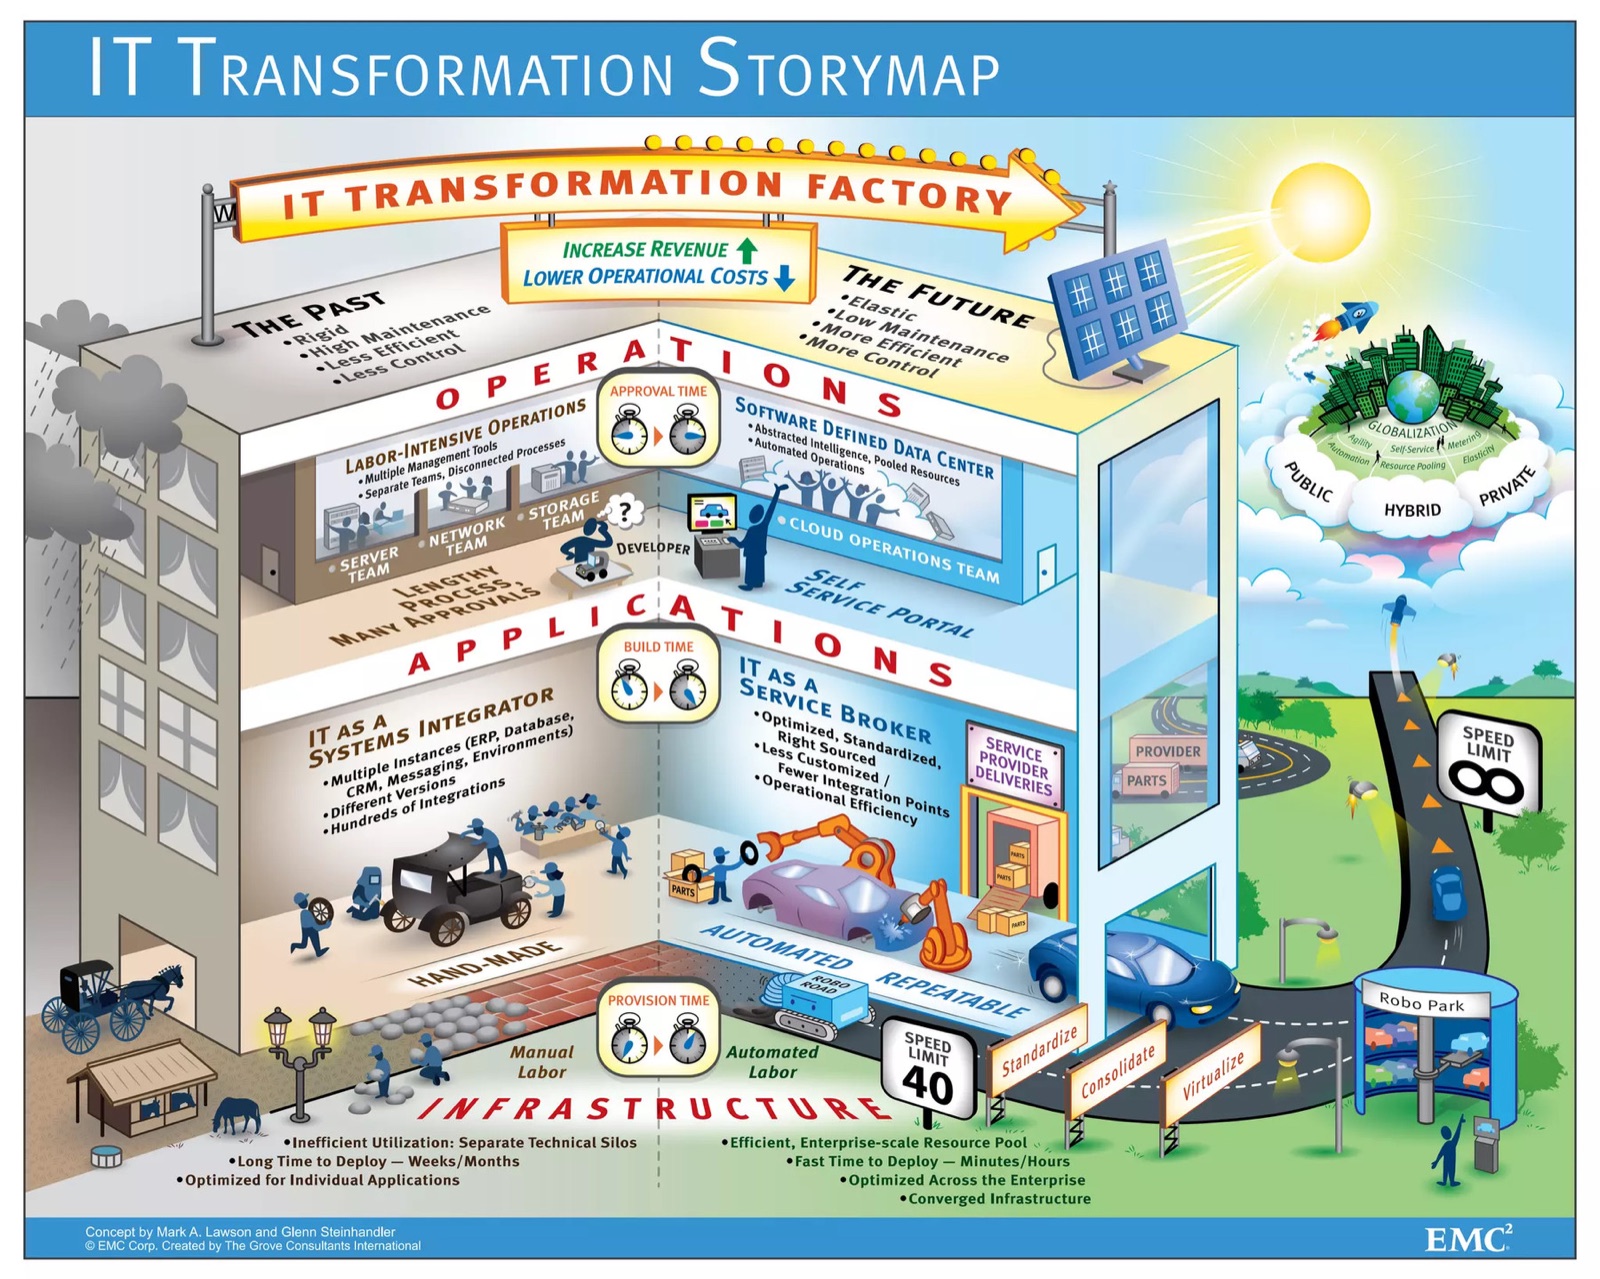
Organizations have to keep adapting to stay ahead, and transformation is now a regular part of business life, not a one-off. It can also be complex and hard to follow. Visualizations and storymaps make it simpler: they help people understand the change and bring everyone together around it.
Understanding Business Transformation
Business transformation involves a fundamental change in how an organization operates, delivers value to customers, and achieves its goals. This can include shifts in strategy, processes, technology, and culture. The need for transformation can arise from various factors, including:
- Market changes: New competitors, evolving customer preferences, and technological advancements can all drive the need for transformation.
- Operational inefficiencies: Outdated processes and systems can hinder an organization's ability to compete effectively.
- Regulatory pressures: Compliance with new regulations may require significant changes in operations.
The Importance of Visualizations
Visualizations are powerful tools that can help organizations communicate complex information clearly and effectively. They can take many forms, including charts, graphs, infographics, and interactive dashboards. Here are some key benefits of using visualizations in business transformation:
- Enhanced comprehension: Visual representations of data make it easier for stakeholders to grasp complex concepts and trends.
- Improved decision-making: By presenting data visually, organizations can identify patterns and insights that may not be apparent in raw data.
- Increased engagement: Visualizations can capture attention and encourage participation in discussions about transformation initiatives.
What Are Storymaps?
Storymaps are a visual storytelling technique that helps organizations map out their transformation journey. They combine elements of narrative and visualization to create a cohesive picture of the transformation process. Storymaps typically include:
- Key milestones: Important events or achievements that mark progress in the transformation journey.
- Stakeholder roles: Identification of who is responsible for each aspect of the transformation.
- Visual elements: Diagrams, images, and other visuals that enhance understanding and engagement.
How to Create Effective Visualizations
Creating effective visualizations requires careful planning and execution. Here are some steps to consider:
Define Your Objectives
Before creating any visualizations, it is essential to define your objectives. What do you want to achieve with your visualizations? Are you trying to communicate a specific message, highlight trends, or engage stakeholders? Clear objectives will guide your design choices.
Choose the Right Type of Visualization
Different types of data require different visualization techniques. Here are some common types of visualizations and their best uses:
- Bar charts: Ideal for comparing quantities across categories.
- Line graphs: Useful for showing trends over time.
- Pie charts: Effective for illustrating proportions within a whole.
- Heat maps: Great for displaying data density or intensity.
Keep It Simple
Simplicity is key when it comes to effective visualizations. Avoid clutter and focus on the most important information. Use clear labels, legends, and colors to enhance understanding.
Test and Iterate
Once you have created your visualizations, gather feedback from stakeholders. Are they easily understood? Do they effectively communicate the intended message? Use this feedback to make improvements.
The Role of Storymaps in Business Transformation
Storymaps play a central role in guiding organizations through their transformation journeys. They provide a structured framework for understanding the process and aligning stakeholders. Here are some ways storymaps can be beneficial:
Aligning Stakeholders
Storymaps help ensure that all stakeholders are on the same page regarding the transformation process. By visually mapping out the journey, organizations can clarify roles, responsibilities, and expectations. This alignment is essential for successful transformation.
Communicating Progress
As organizations progress through their transformation journeys, storymaps can serve as a visual representation of achievements and milestones. This transparency fosters accountability and keeps stakeholders engaged.
Identifying Gaps and Opportunities
Storymaps can also highlight gaps in the transformation process. By visualizing the journey, organizations can identify areas that require additional focus or resources. This proactive approach can lead to more effective transformation efforts.
Practical Examples of Visualizations and Storymaps
Here are two examples of how they work together.
Example 1: A Retail Company’s Transformation Journey
A retail company undergoing a digital transformation might use visualizations to showcase customer data trends. For instance, a line graph could illustrate the increase in online sales over the past year, while a bar chart could compare customer satisfaction ratings across different channels.
In conjunction with these visualizations, the company could create a storymap outlining its transformation journey. This storymap might include milestones such as the launch of a new e-commerce platform, the implementation of a customer relationship management (CRM) system, and the development of a mobile app. Each milestone would include details about stakeholder involvement and key performance indicators (KPIs) to measure success.
Example 2: A Healthcare Organization’s Process Improvement
A healthcare organization looking to improve patient care might use visualizations to analyze patient wait times. A heat map could display wait times across different departments, helping identify bottlenecks.
Alongside these visualizations, the organization could develop a storymap that outlines its process improvement initiatives. This storymap could highlight key milestones such as staff training sessions, the introduction of new scheduling software, and patient feedback mechanisms. By visualizing the journey, the organization can keep stakeholders informed and engaged.
Best Practices for Implementing Visualizations and Storymaps
To maximize the effectiveness of visualizations and storymaps in business transformation, consider the following best practices:
Foster a Culture of Collaboration
Encourage collaboration among stakeholders throughout the transformation process. Involve team members in the creation of visualizations and storymaps to ensure diverse perspectives are represented.
Use the Right Tools
Pick tools that make visualizations and storymaps easier to build and share. Platforms like Tableau, Microsoft Power BI and Miro help with charts and interactive boards; a storymap brings the whole journey together on one page.
Regularly Update Visualizations and Storymaps
As the transformation journey progresses, regularly update your visualizations and storymaps to reflect new developments. This ensures that stakeholders have access to the most current information.
Provide Training and Support
Offer training and support to team members involved in creating and using visualizations and storymaps. This will enhance their skills and confidence in using these tools.
Conclusion
Business transformation is complex, but visualizations and storymaps make it far easier to follow. They build understanding, bring people together and give everyone a clear route.
As you start your own transformation, consider how visualizations and storymaps can support your efforts. Start by defining your objectives, choosing the right visualization techniques, and creating a compelling storymap that aligns stakeholders. With these tools in hand, you can lead the change with confidence and clarity.